with her employment agreement), which was consistent with the disclosure contained in the 2019 proxy statement that no equity awards were outstanding and that any future equity awards were discretionary and were not determinable at that time other than as disclosed.CORPORATE GOVERNANCE
At the Company’s 2019 annual meeting of shareholders, the proposal to adopt the 2019 Equity Incentive Plan was approved by an overwhelming majority of the votes cast by the Company’s minority shareholders (which excludes the shares held by Columbia Bank MHC) with 96.24% of the votes cast by the minority shareholders voting on the proposal in favor of the plan.
General
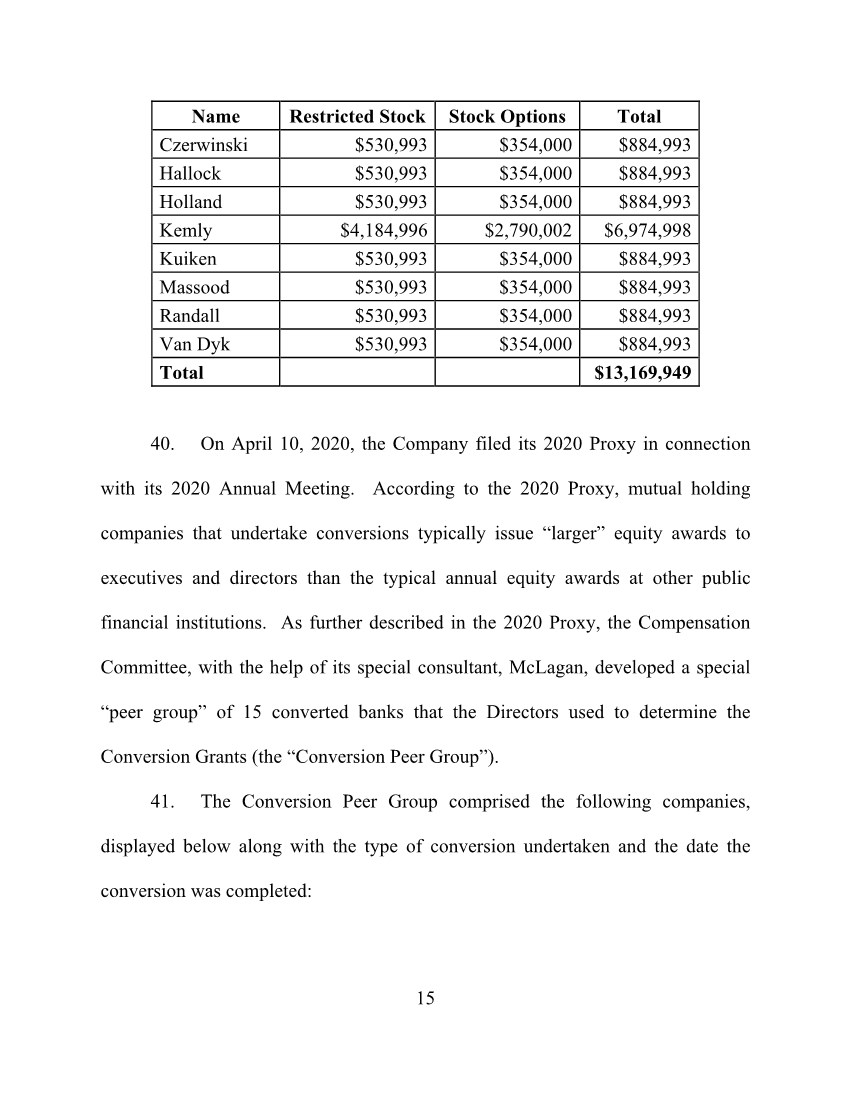
The Company’s 2020 Annual Report on Form 10-K disclosedCompany periodically reviews its corporate governance policies and procedures to shareholders that in July of 2019, the Company had granted, under the 2019 Equity Incentive Plan, 1,389,570 shares of restricted stock with a grant date fair value of $15.60 per share, and options to purchase 3,707,901 shares of Company common stock, with a grant date fair value of $4.25 per option. Those grants were made to executive officers, directors and a total of 1,444 employees of the Company. The Company’s 2020 proxy statement disclosedensure that the Company granted to each non-employee director 34,038 sharesmeets the highest standards of restricted stockethical conduct, reports results with accuracy and options to purchase 83,294 sharestransparency and maintains full compliance with the laws, rules and regulations that govern the Company’s operations. As part of common stock, in each case vesting ratability over five years. The 2020 proxy statement disclosed that the restricted stock and options granted to the non-employee Directors had a grant date fair value of $884,993. The 2020 proxy statement also disclosed that the Company granted to Mr. Kemly 134,134 shares of time-vested restricted stock vesting ratability over five years, options to purchase 656,471 shares of common stock vesting ratability over five years, and 134,135 shares of performance-vested restricted stock that would vest at the end of three years if certain performance targets were met. The restricted stock and options granted to Mr. Kemly had a grant date fair value of $6,974,998, which in part replaced existing long-term incentive compensation as explained below. The restricted stock and options described above for the non-employee directors and Mr. Kemly are referred to as the “2019 Equity Awards.” The 2020 proxy statement further disclosed that Raymond G. Hallock and Henry Kuiken were retiring fromthis periodic corporate governance review, the Board of Directors effective asreviews and adopts best corporate governance policies and practices for the Company.
Code of Ethics and Business Conduct
The Company has adopted a Code of Ethics and Business Conduct that applies to all of its directors, officers and employees, including its principal executive officer, principal financial officer and principal accounting officer and persons performing similar functions. The Code of Ethics and Business Conduct is available upon written request to Corporate Secretary, Columbia Financial, Inc., 19-01 Route 208 North, Fair Lawn, New Jersey 07410 and on the Company’s website at http://ir.columbiabankonline.com. If the Company amends or grants any waiver from a provision of the 2020 Annual Meeting, but would continueCode of Ethics and Business Conduct that applies to remain in serviceits executive officers, it will publicly disclose such amendment or waiver on its website and as required by applicable law, including by filing a Current Report on Form 8-K with the SEC.
Director Independence
Nasdaq Listing Rules require that a majority of our directors and each member of our Audit Committee, Compensation Committee and Nominating/Corporate Governance Committee be independent. A director may be determined to be independent only if the Board has determined that he or she has no relationship with the Company as advisory directors. Underthat, in the termsopinion of the 2019 Equity Incentive Plan, their respective equity awards continue to vest as long as they remain in serviceBoard, would interfere with the Company as advisory directors. Asexercise of independent judgment in carrying out the responsibilities of a resultdirector.
The Nominating/Corporate Governance Committee advises and makes recommendations to the full Board regarding director independence. After considering the committee’s recommendations, the Board affirmatively determined that all current members of the Company’s mandatory director retirement age, Defendant Frank Czerwinski is expected to retire as a directorBoard, other than Mr. Kemly, are independent directors and independent for purposes of the Company atcommittees on which they serve in accordance with applicable Nasdaq and SEC independence rules and requirements. The Board determined that Mr. Kemly is not independent because he is the Company’s 2022 Annual MeetingPresident and it is anticipated that he will serve as an advisory director for the Company following his retirement. Consistent with the termsChief Executive Officer of the 2019 Equity Incentive Plan, his equity awards will continue to vest as long as he remains in service withCompany.
To determine the Company as a memberindependence of the advisory board.
The 2020 proxy statement further disclosed to investors that prior to 2019,directors, the Company had granted its NEOs, including Mr. Kemly, annual Long-Term Incentive Plan (“Cash LTIP”) cash awards using a three-year performance period. The proxy statement stated that for 2019,Board considered certain transactions, relationships, or arrangements between those directors, their immediate family members, or their affiliated entities, on the 2019 Equity Incentive Plan replaced the Cash LTIP and as a result no new Cash LTIP awards were granted in 2019, and further stated that the equity awards granted to the NEOs in 2019 under the 2019 Equity Incentive Plan replaced one half of the earnings opportunity under the Cash LTIP awards previously granted for the 2018 to 2020 performance cycle. No additional Cash LTIP awards were granted to Mr. Kemly in 2020 or 2021,hand, and the Company, on the other hand. Certain directors, their respective immediate family members, and/or affiliated entities have deposit or credit relationships with Columbia Bank in the ordinary course of business. The Board determined that these transactions, relationships, or arrangements were made in the ordinary course of business, were made on terms comparable to those that could be obtained in arms’ length dealings with an unrelated third party, were not criticized or classified, non-accrual, past due, restructured or a potential problem, complied with applicable banking laws, and did not otherwise impair any director’s independence.
Board Leadership Structure
Our Board of Directors has committed notdetermined that the separation of the offices of Chair of the Board and President and Chief Executive Officer enhances Board independence and oversight. Moreover, the separation of the positions of Chair of the Board and President and Chief Executive Officer enables the President and Chief Executive Officer to make any additional Cash LTIP awardsfocus on his responsibilities of running Columbia Financial and Columbia Bank and expanding and strengthening our franchise while enabling the Chair of the Board to Mr. Kemly in 2022 if Mr. Kemly’s 2019 Equity Awards are ratified by the shareholders.
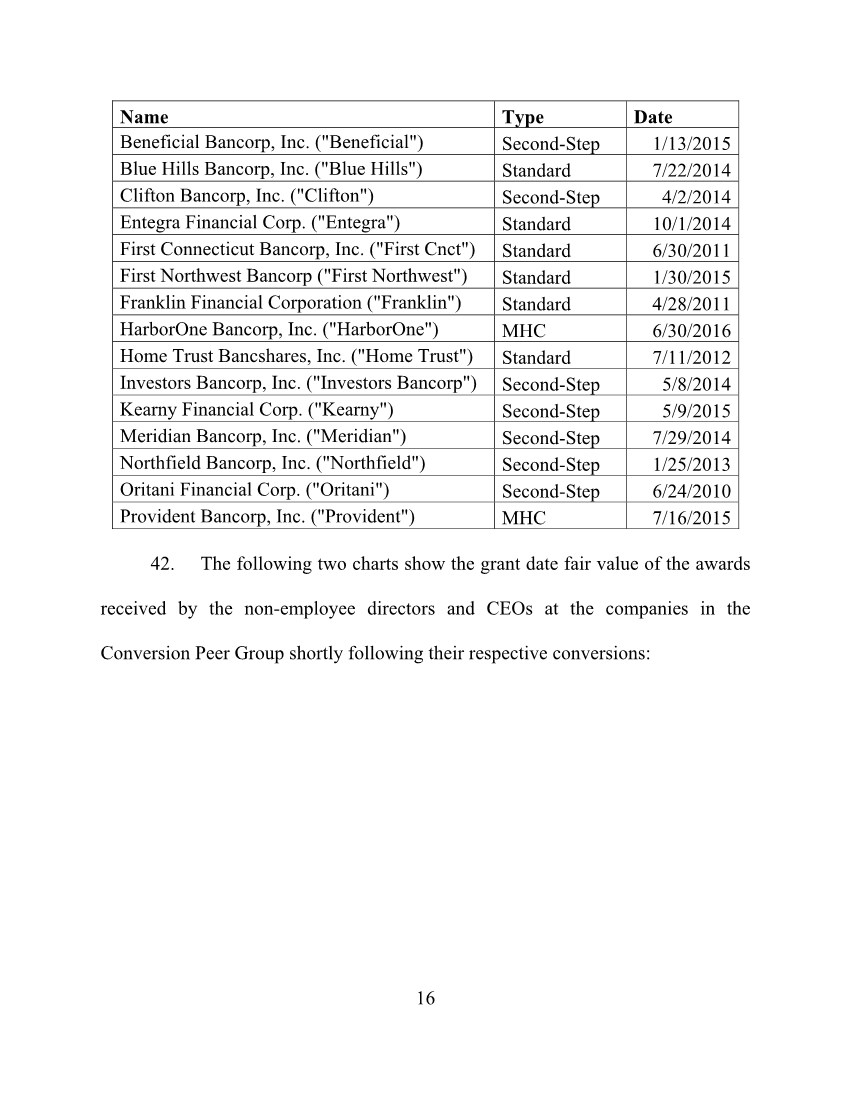
In discussing the equity awards made to the non-employee directors and Mr. Kemly in 2019, the 2020 proxy statement described the process the Compensation Committee andlead the Board of Directors in its fundamental role of providing advice to and independent oversight of management. Consistent with this determination, Noel R. Holland, who is independent under the listing requirements of the Company undertook in determining the size, terms and conditionsNasdaq Stock Market, Inc., serves as Chair of the equity awards, including, among other things, (i) the retention by the Compensation Committee of an independent compensation consultant to provide adviceBoard and information to the Compensation Committee with respect to the equity awards made under the 2019 Equity Incentive Plan to the NEOsThomas J. Kemly serves as President and the non-employee directors; (ii) bank regulatory guidelines on such plans; (iii) awards made by identified peer group companies that had undergone a conversion transaction (the “Conversion Peer Group”); (iv) the fact that the executives and non-employee directors had never previously had the opportunity to participate in the organizational value growth of the Company through equity ownership and the value of such individuals in contributing to the success of the Company and the expected contribution of such individuals going forward; and (v) the common industry practice for the prevalence and magnitude of equity awards following conversion transactions taking into account awards made by the Conversion Peer Group. For a further discussion of the 2019 Equity Awards and the processChief Executive Officer.
![[MISSING IMAGE: lg_columbia02-4c.jpg]](https://capedge.com/proxy/DEF 14A/0001104659-22-026060/lg_columbia02-4c.jpg)
![[MISSING IMAGE: lg_columbia02-4c.jpg]](https://capedge.com/proxy/DEF 14A/0001104659-24-052992/lg_columbia02-4c.jpg)
![[MISSING IMAGE: sg_thomasj-kemly.jpg]](https://capedge.com/proxy/DEF 14A/0001104659-24-052992/sg_thomasj-kemly.jpg)
![[MISSING IMAGE: sg_mayra-bw.jpg]](https://capedge.com/proxy/DEF 14A/0001104659-22-026060/sg_mayra-bw.jpg)
![[MISSING IMAGE: sg_mayralrinaldi-bw.jpg]](https://capedge.com/proxy/DEF 14A/0001104659-24-052992/sg_mayralrinaldi-bw.jpg)
![[MISSING IMAGE: pc_independence-4c.jpg]](https://capedge.com/proxy/DEF 14A/0001104659-24-052992/pc_independence-4c.jpg)
![[MISSING IMAGE: pc_diversity-4c.jpg]](https://capedge.com/proxy/DEF 14A/0001104659-24-052992/pc_diversity-4c.jpg)
![[MISSING IMAGE: pc_gender-4c.jpg]](https://capedge.com/proxy/DEF 14A/0001104659-24-052992/pc_gender-4c.jpg)
![[MISSING IMAGE: bc_tenure-4c.jpg]](https://capedge.com/proxy/DEF 14A/0001104659-24-052992/bc_tenure-4c.jpg)
![[MISSING IMAGE: bc_boardage-4c.jpg]](https://capedge.com/proxy/DEF 14A/0001104659-24-052992/bc_boardage-4c.jpg)
![[MISSING IMAGE: ph_noelholland-4c.jpg]](https://capedge.com/proxy/DEF 14A/0001104659-24-052992/ph_noelholland-4c.jpg)
![[MISSING IMAGE: ph_bobvandyk-4c.jpg]](https://capedge.com/proxy/DEF 14A/0001104659-24-052992/ph_bobvandyk-4c.jpg)
![[MISSING IMAGE: ph_lucysorrentini-4c.jpg]](https://capedge.com/proxy/DEF 14A/0001104659-24-052992/ph_lucysorrentini-4c.jpg)
![[MISSING IMAGE: ph_tomkemly-4c.jpg]](https://capedge.com/proxy/DEF 14A/0001104659-24-052992/ph_tomkemly-4c.jpg)
![[MISSING IMAGE: ph_jimkuiken-4c.jpg]](https://capedge.com/proxy/DEF 14A/0001104659-24-052992/ph_jimkuiken-4c.jpg)
![[MISSING IMAGE: ph_paulvanostenbridge-4c.jpg]](https://capedge.com/proxy/DEF 14A/0001104659-24-052992/ph_paulvanostenbridge-4c.jpg)
![[MISSING IMAGE: ph_mikemassood-4c.jpg]](https://capedge.com/proxy/DEF 14A/0001104659-24-052992/ph_mikemassood-4c.jpg)
![[MISSING IMAGE: ph_elizabethrandall-4c.jpg]](https://capedge.com/proxy/DEF 14A/0001104659-24-052992/ph_elizabethrandall-4c.jpg)
![[MISSING IMAGE: ph_dariatorres-4c.jpg]](https://capedge.com/proxy/DEF 14A/0001104659-24-052992/ph_dariatorres-4c.jpg)
![[MISSING IMAGE: tm225669d1-bc_perf4clr.jpg]](https://capedge.com/proxy/DEF 14A/0001104659-22-026060/tm225669d1-bc_perf4clr.jpg)
![[MISSING IMAGE: bc_assets-4c.jpg]](https://capedge.com/proxy/DEF 14A/0001104659-24-052992/bc_assets-4c.jpg)
![[MISSING IMAGE: bc_deposits-4c.jpg]](https://capedge.com/proxy/DEF 14A/0001104659-24-052992/bc_deposits-4c.jpg)
![[MISSING IMAGE: bc_netinterest-4c.jpg]](https://capedge.com/proxy/DEF 14A/0001104659-24-052992/bc_netinterest-4c.jpg)
![[MISSING IMAGE: bc_netincome-4c.jpg]](https://capedge.com/proxy/DEF 14A/0001104659-24-052992/bc_netincome-4c.jpg)
![[MISSING IMAGE: bc_loans-4c.jpg]](https://capedge.com/proxy/DEF 14A/0001104659-24-052992/bc_loans-4c.jpg)
![[MISSING IMAGE: bc_nonperforming-4c.jpg]](https://capedge.com/proxy/DEF 14A/0001104659-24-052992/bc_nonperforming-4c.jpg)
![[MISSING IMAGE: bc_noninterest-4c.jpg]](https://capedge.com/proxy/DEF 14A/0001104659-24-052992/bc_noninterest-4c.jpg)
![[MISSING IMAGE: bc_branch-4c.jpg]](https://capedge.com/proxy/DEF 14A/0001104659-24-052992/bc_branch-4c.jpg)
![[MISSING IMAGE: pc_23ceoneo-4c.jpg]](https://capedge.com/proxy/DEF 14A/0001104659-24-052992/pc_23ceoneo-4c.jpg)
![[MISSING IMAGE: lc_tsr-4c.jpg]](https://capedge.com/proxy/DEF 14A/0001104659-24-052992/lc_tsr-4c.jpg)
![[MISSING IMAGE: lc_netincome-4c.jpg]](https://capedge.com/proxy/DEF 14A/0001104659-24-052992/lc_netincome-4c.jpg)
![[MISSING IMAGE: lc_bankcoreroaa-4c.jpg]](https://capedge.com/proxy/DEF 14A/0001104659-24-052992/lc_bankcoreroaa-4c.jpg)
![[MISSING IMAGE: px_24columbiaproxy1pg1-bw.jpg]](https://capedge.com/proxy/DEF 14A/0001104659-24-052992/px_24columbiaproxy1pg1-bw.jpg)
![[MISSING IMAGE: tm225669d3-px_1columbw.jpg]](https://capedge.com/proxy/DEF 14A/0001104659-22-026060/tm225669d3-px_1columbw.jpg)
![[MISSING IMAGE: px_24columbiaproxy1pg2-bw.jpg]](https://capedge.com/proxy/DEF 14A/0001104659-24-052992/px_24columbiaproxy1pg2-bw.jpg)
![[MISSING IMAGE: tm225669d3-px_2colum4c.jpg]](https://capedge.com/proxy/DEF 14A/0001104659-22-026060/tm225669d3-px_2colum4c.jpg)